 Mark Parham
In this article
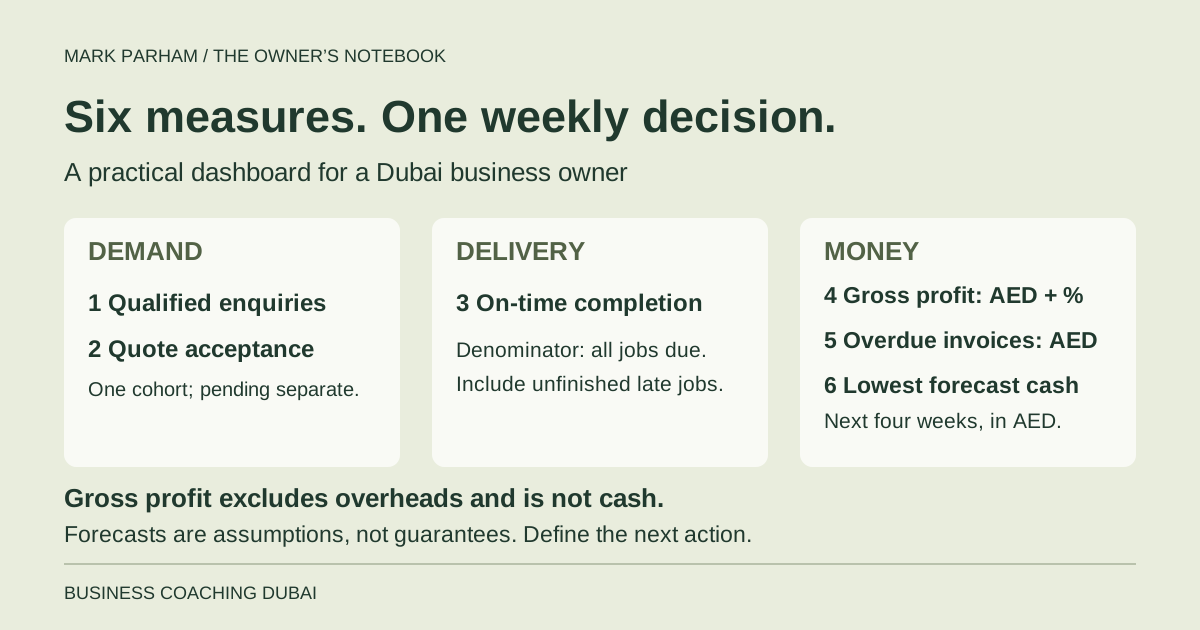
A useful Dubai small-business dashboard connects demand, delivery and money to decisions you can make this week. Start with six measures: qualified enquiries, quote acceptance, on-time completion, gross profit margin, overdue invoices and the lowest forecast cash balance. Give each a clear definition, source, owner and response when it moves.
A dashboard full of green numbers can still hide a difficult business. Sales may be rising while delivery slips. Invoices may be going out while cash is not coming in. Website visits may be increasing without generating enquiries you can serve profitably.
I would start with a single sheet for a small service business. The six measures below are a practical starting model, not compulsory KPIs for every Dubai firm. A retailer or stockholding trader will need to adapt it to the way its business works.
Give every number a decision
Before adding a metric, finish this sentence: “If this changes, we will consider…” If you cannot finish it, the number may belong in a supporting report rather than the weekly dashboard. You want a short route from observation to investigation and action.
Each row needs its reporting period, current value, comparison, source, update date and owner. Add a short note about the decision or follow-up required. Use AED consistently for money, and label the accounting basis so you do not compare figures prepared differently.
Set review thresholds from your own capacity, costs and trading history. The Business Development Bank of Canada’s guidance on financial indicators stresses that appropriate measures and standards vary between businesses. A figure from another market is not a Dubai benchmark.
1. Qualified enquiries: count opportunities you can serve
Define a qualified enquiry before counting it. For example, a potential customer needs a service you provide, falls within your delivery area and has given enough information for a useful next conversation. Choose criteria that suit your business and apply them consistently.
Exclude duplicate messages, spam and existing-customer service questions from new opportunity counts. Record the source and customer type where useful. A WhatsApp click, form start or page visit is not automatically an enquiry, and an enquiry is not booked revenue.
If the count falls, inspect the source and segment before increasing marketing spend. Did fewer suitable people arrive, or did the team stop recording conversations? If enquiries rise but capacity is full, the next decision may concern qualification, timing or pricing rather than acquiring more.
2. Quote acceptance: use the same group on both sides
Choose a defined group of quotes, such as all those sent in September, and report their position at a stated date. Divide accepted quotes from that group by all quotes in the group. Keep pending and withdrawn cases visible, and use the same method next time.
For illustration, twelve accepted quotes out of thirty is 40%. If another eight remain pending, the result is still developing. Calling it the final win rate would be misleading. Do not divide this week’s accepted quotes by this week’s new quotes when the accepted work was quoted earlier.
Investigate lost reasons, scope and follow-up. A lower rate may reflect weaker fit rather than poor selling. An unusually high rate alongside shrinking margins may deserve a pricing review. If there are no quotes in the chosen group, show “not applicable” rather than a manufactured zero percentage.
3. On-time completion: include the unfinished jobs
Count jobs due in the period, then count how many were completed by their agreed deadline. Divide the second number by the first. Keep the promise you are measuring explicit, and record agreed changes so missed commitments cannot disappear through casual date editing.
If eighteen of twenty jobs due this week finished on time, the result is 90%. The two unfinished jobs remain in the denominator. Looking only at completed jobs would hide the very backlog you need to understand. With no jobs due, show that clearly instead of calculating a percentage.
Review the causes: missing customer information, unrealistic scheduling, unavailable materials or rework. Assign the relevant action to someone who can address it. The simple business systems guide explains how to make those handovers and exceptions visible.
4. Gross profit margin: keep it separate from cash
For a consistently prepared reporting period, gross profit is revenue less direct costs. Gross profit margin is gross profit divided by revenue, multiplied by 100. Agree the cost classification with your accounts person and apply it consistently. Gross profit still has to cover overheads; it is not net profit.
Here is an illustrative job, with amounts stated on the same basis. Revenue of AED 20,000 less direct costs of AED 12,000 leaves AED 8,000 gross profit, a 40% gross margin. That does not mean AED 8,000 has arrived in the bank or is available to withdraw.
Show the AED amount beside the percentage. If the measure weakens, inspect service mix, estimating errors, discounts and unexpected delivery costs. Avoid making a decision from one unusual job. The BDC dashboard guide explains why gross profit and cash collection need separate attention.
5. Overdue invoices: show the money and the next action
At a stated snapshot date, total unpaid amounts that are past their agreed payment date. Keep the supporting invoice list, including the customer, balance, due date, any dispute and the next agreed action. A single total cannot tell you which problem needs solving.
Separate a genuine collection issue from an administrative error. Was the invoice received by the right person? Is a required reference missing? Has the customer raised a delivery dispute? A reminder is not a complete response if the underlying problem remains unresolved.
Use this measure to organise a practical follow-up conversation. Keep the owner and due date for each action visible. Do not confuse the overdue total with all outstanding invoices: an unpaid invoice that is not yet due belongs in a different category.
6. Lowest forecast cash balance: look ahead
Start with usable opening cash, add expected receipts and subtract expected payments week by week for the next four weeks. Display the lowest forecast balance, not just the closing balance. Check dates and avoid counting the same invoice receipt twice.
Suppose an illustrative week starts with AED 30,000, has expected receipts of AED 10,000 and payments of AED 28,000. The forecast closing balance is AED 12,000. If those receipts arrive late, the same week ends at AED 2,000. The timing assumption changes the decision.
A forecast is not a guarantee. Review uncertain receipts and known commitments with your accounts person, and compare forecasts with actual movements. A week-end sheet can still hide a midweek shortfall, so inspect daily timing when the margin for error is small.
Use Dubai market information as context
Dubai’s Department of Economy and Tourism publishes research and market insights. Relevant industry information can help you investigate a change in demand. It should sit beside your own evidence, not replace it.
For a business serving visitors, compare relevant periods and customer groups. For a business serving other companies, procurement timing and a few larger accounts may matter more. City-wide growth does not demonstrate that your own jobs are profitable or that your invoices will be paid on time.
Keep useful segments visible without creating dozens of tiny dashboards. Separate materially different services or customer types where the distinction changes a decision. Record unusual events, but do not use them as an automatic explanation for every disappointing result.
Turn the weekly review into three actions
Check the freshness of the data first. Then identify the largest concern, investigate the likely cause and choose the next action. You can use three priority groups: act now, investigate, and monitor. Do not spend the entire meeting explaining numbers nobody trusts.
Keep at most three active improvements on the owner’s weekly list. Give each a responsible person and review date. If the same metric keeps prompting the same discussion, examine whether the action was actually completed and whether it addressed the cause.
The worksheet below helps you define the six measures and choose next week’s focus. Pair it with the weekly owner review. If you want to work through the dashboard with me, bring the current figures and the decision they are supposed to help you make.
Put this into practice · Free resource
Six-number owner dashboard worksheet
Open the worksheet, fill in your own examples and print or save your completed copy. No email needed.